Fig. 2
Download original image
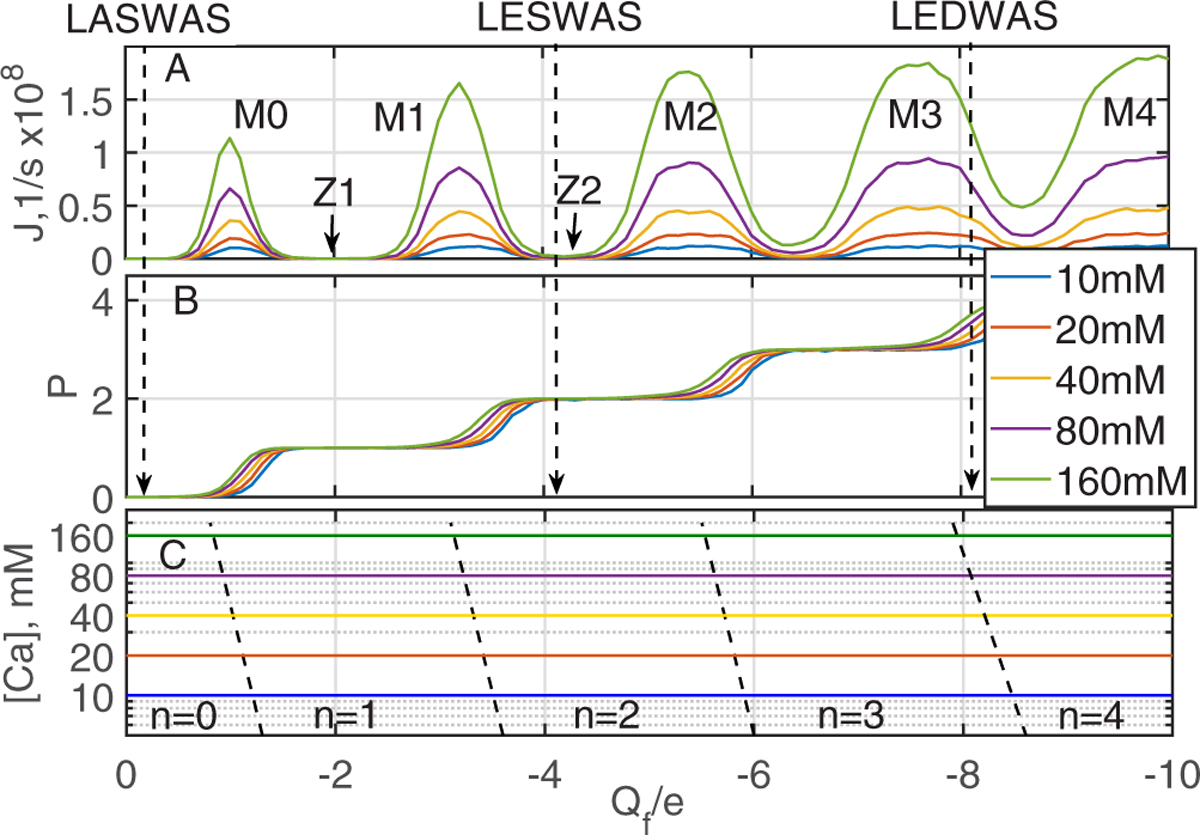
Multi-ion Ca2+ conduction/occupancy bands in the model calcium/sodium channel, showing occupancy shifts with ionic concentration. (A) Strong multi-ion calcium conduction bands Mn as established by Brownian dynamics simulations. (B) The corresponding Coulomb staircase of occupancy Pc for different values of the extracellular calcium concentration [Ca], as marked, consists of steps in occupancy that shift slightly as [Ca] changes. The neutralized states Zn providing blockade are interleaved with resonant states Mn. The vertical black-dashed lines show the nominal positions of the LESWAS and LEDWAS channel/mutants. (C) Coulomb blockade-based phase diagram. The positions of the {n} → {n + 1} transitions (from Eq. (6)) are shown as sloping black-dashed lines. The horizontal coloured lines are guides to the eye, indicating the three concentrations used in the simulations. The diagram is consistent with the logarithmic [Ca]-related shift of steps in the Coulomb staircase shown in (B).